“There was no telling what people might find out once they felt free to ask whatever questions they wanted to.” - Joseph Heller, Catch-22
Separating product features into "Must-haves", "Should-haves", "Could-haves" and "Would-haves" (commonly known as MoSCoW) can provide a great deal of information about how to prioritize work for a new product release. This approach gives us a way to separate features into three categories:
- Threshold features are those that must be present in the product for it to be successful
- A linear feature is one for which “the more, the better” expression holds true. These are called linear features because customer satisfaction is correlated linearly with the quantity of the feature. The better one of these features performs, the more satisfied the customers will be
- Exciters and delighters are those features that provide great satisfaction, often adding a price premium to a product. However, the lack of an exciter or delighter will not decrease customer satisfaction below neutral
Because must-have features are required for a product to play in its market segment, emphasis should be placed on prioritizing the development of all threshold features. A product’s must-have features do not need to be developed in the first iterations of a release. However, because users consider these features mandatory, they need to be available before the product is released. Keep in mind, though, that partial implementation of must-have features may be adequate, because gains in customer satisfaction drop off quickly after a base level of support for threshold features has been established.
Secondary emphasis should be placed on completing as many linear features as possible. Because each of these features leads directly to greater customer satisfaction, the more of these features included, the better. Finally, and with time permitting, at least a few delighters should be prioritized such that they are included in the release plan.
Karl Wiegers’ Relative Weighting Method
Karl Wiegers' approach considers both the benefit of the presence of a feature and the negative impact of its absence. This approach relies on expert judgement. Collaboratively, but led by the Product Owner, the team assesses each feature being considered for prioritization. Each feature is assessed in terms of the benefits it will bring if implemented, as well as the penalty that will be incurred if it is not implemented. As with estimates of story points and ideal time, the estimates of benefits and penalties are relative.
By cross-referencing the answer to the functional question with the answer to the dysfunctional one, a prospective user’s responses can be reduced to a single meaning. So, if a user says they expect to be able to graph event times and that they would dislike it if they couldn’t, we cross-reference those answers and get that they consider the feature to be mandatory. In their mind, graphing event times is a must-have feature.
To rank the features, we need to assign values for the Relative Benefit and Relative Penalty from 1 to 10, with 1 being the lowest and 10 being the highest value. For each feature, the relative benefit and penalty are summed and entered in the Total value column. The sum of the Total value column (in this case, 33) represents the total value of delivering all features. To calculate the relative contribution (Value %) of each feature, divide its total value by the sum of the Total value column. For example, Feature 1 has a value of 14. The total value of all features is 33. Dividing 14 by 33 results in 0.42, or 42%. This means that Feature 1 represents 42% of the total value of all listed features.
The next column, Estimate, holds the story-point or ideal-days estimate. The preference is for story points. As with Total value, the Estimate column is summed (61, in this case) and the percentage of each estimate is calculated in the Cost % column. In this example, Feature 1 is estimated at 32 story points. The three combined are 61 story points. So, Feature 1 represents 53% of the total cost of these three stories (32 / 61 = 0.53 or 53%).
The final column, Priority, is calculated by dividing the Value % by the Cost %. Higher numbers represent higher priorities because they will create more value for the effort invested in them.
The method for categorizing the responses is shown in the following table.
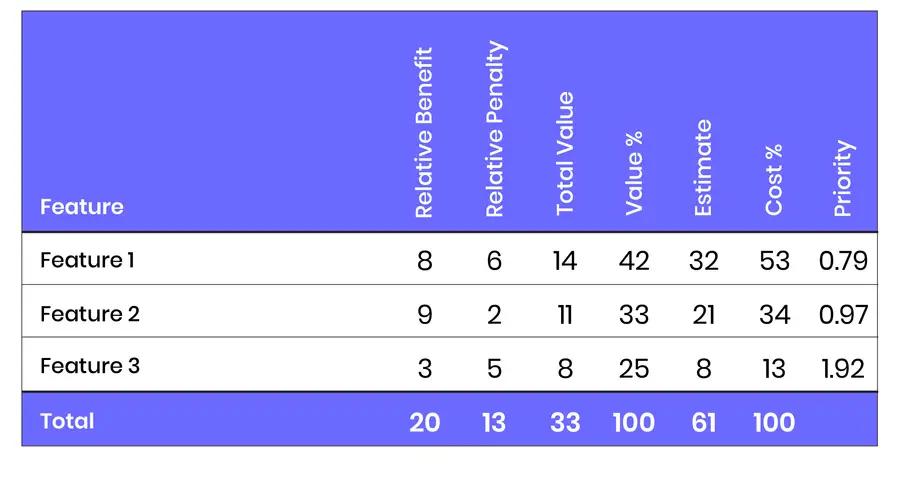
You can see this in the table by looking at the Feature 3. This feature generates a little more than half the value of Feature 1 (a Total value of 8 compared with 14), but it does so at one fourth of the cost (an estimate of 8 compared with 32). Because of its high value-to-cost ratio, Feature 3 is the highest-priority feature in this analysis.
The goal of this exam is to provide the ordering that will satisfy each stakeholder's expectations. In reality, this is a very difficult task to achieve. Most stakeholders’ expectations can be conflicting but an agreement and commitment by all stakeholders is paramount. Very rarely, the ordering is entirely accepted at a first glance; although most of the items are ordered properly, some can be found misaligned. Certain stakeholders have given Benefit and Penalty values hoping that they are sufficient to raise the certain item higher in the backlog. However, after the initial ordering, tweaks in these two categories can be proposed and they should be allowed if stakeholder reasons are clear and accepted by all other concerned parties.
Note: This process is iterative and should be seen as producing a living document (a backlog), i.e., it can change in time as expected with any software engineering project. The revision can happen in a predetermined reoccurrence specified and agreed at the first prioritization meeting, or per need as the items in the backlog are being completed.
Delivery timetable
Within this stage we will start working on specifying the top priorities in more detail and schedule estimating sessions with the Project Development Leads and Chief Architects that will enable us to define estimated release dates. The dates would ideally be defined monthly or quarterly depending on the scope of the feature. This would again be a big picture estimate and would include the design (both architectural and UX/UI), implementation (development and testing), and feedback from User Acceptance Testing (UAT). Initially, everything will be provisionally estimated, although in greater depth than in the previous phases, something like the referent epic discussed in phase two; all dependencies considered; revised continuously to provide a more accurate delivery plan as the iterative development progresses.
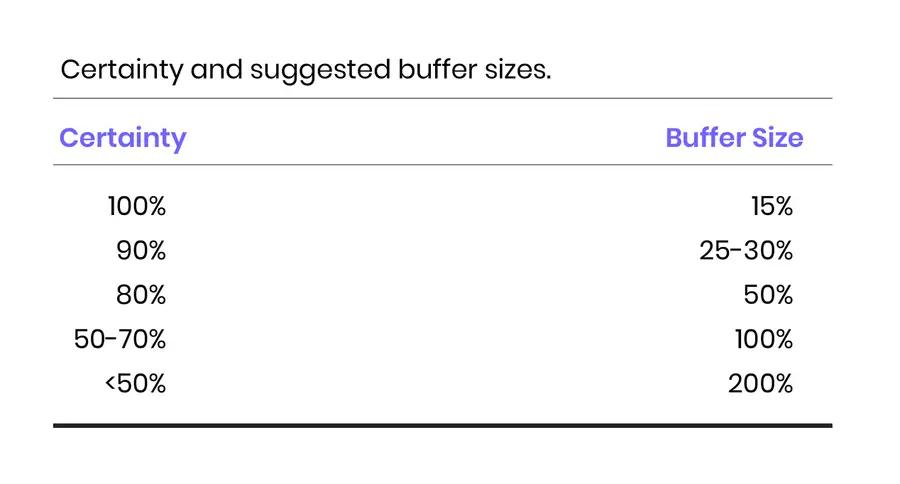
Even if you have a reasonable understanding of the requirements and know who will compose the team, the risk of being wrong is significant. In these cases, there is either greater uncertainty or greater implication to being wrong about a delivery schedule. Because of this, it is useful to include a buffer in the determination of the schedule. A buffer is a margin for error around an estimate. In cases where there is significant uncertainty or the cost of being wrong is significant, it would be wise to include a buffer. It helps protect the project against the impact of the uncertainty. In this way, buffering a project schedule becomes an appropriate risk management strategy.
Creating a feature buffer is simple to do on an agile project. First, the customer selects all the mandatory work. This represents the minimum that can be released. The customer then selects another 25% to 40% more work, selecting toward the higher end of the range for projects with more uncertainty or less tolerance for schedule risk. The estimates for this work are added to the original estimate, resulting in a total estimate for the project. The project is then planned as normal for delivery of the entire set of functionalities.
To protect a project schedule against uncertainty, we need a way to quantify the uncertainty. When we estimate and assign a single value to a user story, we pretend that a single number reflects our expectations about the amount of time it will take to develop the feature. More realistically, though, we know the work may be completed within a range of durations. A team may estimate a particular user story as three-story points, knowing that three story-points typically represents four or five elapsed days of work. If the story takes six days to complete, however, no one will be shocked; things sometimes take longer than planned. There normally is not much that can be done to accelerate the completion of a task, but there are an indefinite number of things that can go wrong and delay the completion of a task.
Suppose we want to be 90% confident in the schedule we commit to. One initial approach to doing this might be to estimate the 90% likely duration for each user story in the project and then use those estimates. However, if we do this, the project schedule will almost certainly be too long. The first number for each task is the 50% estimate of how long the task should take. I expect tasks to take longer half the time and shorter half the time. The second number is the additional amount of time to reach the 90% estimate. The additional time between the 50% and the 90% estimate is called local safety.
Adding up the 50% numbers gives us an expected duration of, approximately, an hour and ten minutes. On the other hand, adding up the 90% estimates gives a total of two hours and fifty minutes. The ideal plan is built using the 50% estimates and then adding a project buffer. This type of plan makes much more sense than the one built entirely from summing the 50% or the 90% estimates. The plan protects the only deadline that matters: the overall project deadline.
Because our estimates are at the 50% and 90% points for each item, this means that the difference between these two estimates is about two standard deviations. The standard deviation for each item is then wi-ai2 , where wi represents the worst case (the 90% estimate) for the story and ai represents the average case (the 50% estimate) for the same story. We would like the project buffer to protect the overall project to the same 90% estimate level that each task was protected by. This means our project buffer should be two standard deviations and can be determined from this formula:

Final Review and Approval
Within the final stage, the backlog with provisionally estimated dates will be presented to the stakeholders or stakeholder representatives by the Delivery Manager, with support from the Project Development Leads and the Software Architect for providing answers for any technical concerns. The goal of this session is to cover any potential questions and to get formal approval on the prioritized backlog in order to create the roadmap and begin the development process.
Collecting an approval for each item in the list might be a tedious process, but it will create an initial roadmap that can give a starting point and a general direction. However, certain items might be deemed unacceptable by the stakeholders, for which we need to go back to phase 2 where we will refine or reduce the scope for each requirement and continue the process as described. Some items might even go back as far as phase 1 after some time, when more information is known, and the product knowledge has increased. The process is complete when the list and projects are acceptable to every stakeholder, but the backlog lives as long as the product is being developed. So, the process iterates.
Conclusion
Every start of a project is difficult, even more so when there are different stakeholders with conflicting requirements, which is usually the case. Finding oneself in these situations can be demotivating and even terrifying, but it should not be so. There is a certain satisfaction in knowing how much lies ahead and how much can be done. Until there are requirements and change requests for a product, that product lives, and it can be managed. Even with an existing and ongoing product, there comes a point where a certain refreshment is needed, and this process can quench that thirst.
Keeping in mind that any agile process is iterative, and one can come back to a phase at any point in time, can be both a relief and a frustration. There should be a clear set of objectives, but also boundaries set up front that will guide the execution of any process to its completion. In the end, the goal of the process is to bring a return to its investors, provide higher value to its customers and increase the quality of the service it offers.
However, there is one greater goal in creating and standardizing processes, and that is to serve the profession. Our duty to our work is to leave it better for the ones that will come after us. It is said that there are three traits to every good manager, the “three ‘Always’ of leadership”: always be deciding, always be scaling and always be leaving. For anything to be ready to be handed over, it should be created with the purpose to be changed, to be improved, or to be discarded and replaced with something better - an egoless state of existence for the sole purpose of serving the current needs of its generation.
Read the first article of the Eliciting, estimating, and prioritizing an epic backlog to deliver value series.